Economic Affairs, Vol. 64, No. 4, pp. 803-812, December 2019
DOI: 10.30954/0424-2513.4.2019.16
©2019 EA. All rights reserved
Changing Cropping Pattern in Kheri District, Uttar Pradesh, India
Moin Khan* and Ateeque Ahmad
Department of Geography, Aligarh Muslim University, Aligarh, Uttar Pradesh, India
*Corresponding author: khan.moin716@gmail.com (ORCID ID: 0000-0003-3780-9850)
Received: 07-07-2019
Revised: 09-10-2019
Accepted: 21-11-2019
ABSTRACT
The aim of this study is to examine the cropping pattern in Kheri District, Uttar Pradesh, India. This paper also estimated the changing cropping pattern at the block level between 2009-10 and 2014-15, how the choices of the farmers are changing for the alteration of crops with the time motivated by modern technologies, land disintegration, frequent flash floods, deforestation, fluctuation on the market, etc. Kheri district has been considered as the study area for this research paper. The study has been carried out at the block level. The data has been derived from the district statistical handbooks. Field visits and personal interviews have been done to fathom the real situations and motivating factors for the changing crop pattern. The findings demonstrate that there is a net loss in the cropped area in the district during 2010 and 2015. The crop pattern changed in these five years. The area under cereal crops declined and sugarcane cultivation accelerated. Market and flash floods were the main factors to affect the acreage of the crops.
Highlights
 Being a major producer of sugarcane in the country, Kheri district is gaining the area under sugarcane cultivation with the time.
Keywords: cropping pattern, agriculture, Kheri district
Cropping pattern refers to the proportion of area under various crops at a point of time, change in this distribution over a period of time and factors affecting this change in distribution (Misra & Puri, 2011). In fact, the Cropping pattern is a dynamic concept as it changes with time and space. In any particular area, it is subjected to change from time to time with the affecting conditions. The cropping pattern of an area is largely determined by the physical, socio-cultural and historical factors (Akhtar, 2015). Cropping patterns concerned with the extent to which the arable land under different agriculture can be put to use (Singh and Dhillon, 2005; Seitinthang, 2013,). A diversified cropping pattern is considered a good strategy to cope with risk and uncertainty associated with agriculture caused by climatic and biological vicissitude (Shiyani and Pandya, 1998, Mandal, 2010,). Many researchers suggested in 1980s and 1990s that poor farmers are risk adverse-i.e. they are supposed to accept low income but with low risk than being excited to get higher income attached with higher risk (Binswanger 1980; Antle 1988; Anderson and Dillon 1992; Ali and Ali 2006).
Indian agriculture growth in the post-independence period can be identified in four different periods- the pre-green revolution phase, the first phase of the green revolution, second phase of green revolution and liberalization phase (Subrahmanyam and Shekhar, 2003). Since, the advent of green revolution in India, agriculture pattern has
How to cite this article: Khan, M. and Ahmad, A. (2019). Changing cropping pattern in Kheri district, Uttar Pradesh, India. Economic Affairs, 64 (4): 803-812.
undergone substantial transformation, much of which is reflected in the changing cropping pattern of the country. Consequently, a significant variation in the cropping pattern throughout India has been witnessed (Dhinsa and Sharma, 1995). After the introduction of modern technologies, monoculture of commercially important crops, intensive cultivation of high yielding varieties, overlapping of cropping seasons and excessive use of agrochemicals have increased the potential of pests and diseases (Shetty, 2004).
The proportion of area under different crops at a point of time is referred to as the cropping pattern of that particular area or region. A number of factors are responsible for any specific cropping pattern of a region, therefore, cropping pattern is prone to change every year with the variability of various factors affecting the crops. For example, the cropping pattern of India is determined by the intensity of monsoon to a great extent. In the years, when the monsoon is good, rice is widely planted throughout the country while in the monsoon failure years, the dry crops like bajra, maize, groundnut, urad, sesame, etc. which need less amount of water are largely cultivated. Although, the disintegration of lands with increasing population, market failure, and environmental risk leads to the introduction of new copping pattern. Besides, the crops are also intensified with the help of modern means of technology and HYV (High Yielding Variety) seeds that also resulted in the crop specialization. For Instance, two crops of rice are being cultivated in the semi-arid region of Punjab, Haryana and Western Uttar Pradesh with the help of modern means of irrigation.
Agriculture is the predominant economic activity in Kheri district. Indian Census 2011 revealed that about 65 percent of the main and marginal workers were engaged in agriculture and this sector supports nearly 80 percent of the population directly or indirectly, which explicitly shows the over-dependency of the population on agriculture. Lying in the Terai plains of India, Kheri district exhibits fertile land and adequate amount of underground water which helps in the acceleration of agriculture productivity. The overall economic development of district is largely depending on the progress of agriculture sector. Kheri district is widely notable for the sugarcane cultivation and sugar production. Rice and wheat are other important crops throughout the district.
Literature Review
Ghosh (2011) examined cropping pattern changes in Indian Agriculture in the duration of 1970-71 to 2006-07. It has been found out the cropping pattern in India in terms of area under cultivation is skewed towards food grains. However, the farmers, recently, adopted some popular non-food grain cash crops such as sugarcane, oilseeds cotton, and vegetables (Bhalla and Singh, 1997). The crop pattern of a specific area is influenced by various factors like the spread of irrigation leading to area shrinkage of dry crops, the technological change among crops, market intervention and support by the government in particular crops but not in other crops, and, perhaps the most important of all, the changing relative prices between different crops (Ray, 1983, Datewala, 1986). However, in the Mekong Delta, the rice cropping pattern drastically changed. In the tide-affected floodplain (middle reach of the delta), new methods like direct-seeding sa chai replaced the conventional double transplantation and year- round cultivation replaced single cropping. The cultivation of floating rice in the high flood plains was reduced by the acceleration in the cultivation of high-yielding rice varieties (Fukui 1974, Chiem 1994).
In Egypt, there was a significant decline in the area under onion, garlic, barley, flax, chickpeas, lentil, fenugreek and lupine crops since they were considered as non-strategic crops. However, strategic crops such as wheat, maize, clover, rice, sugar and cotton experienced no change (Boustani & Moahammadi 2010; Osama et al. 2017). While discussing the usefulness of alternative levels of water use over the fixed yield approach when there is a restraint on water. In the multi-crop farm models used, a water production work for each crop could be incorporated so that one has the decision of choosing alternative levels of water use on the basis of water availability (Kumar and Khepar, 1980). Crop diversity affected yields in three crops, the strongest effects of crop rotation were on maize, where overyielding was over 100 percent in some treatments. In the period of three years, a significant positive linear relationship was reported between the number of crop species in the rotation and maize yield (Smith et al. 2008). In India, the cropping pattern in Assam state is highly disturbed every year by the frequent floods. The crops, livestock and property are damaged every year, therefore, the farmers had to adjust their cropping pattern every year (Mandal 2010). There was very little change in cropping pattern in Manipur state during the period under investigation. The district in Imphal valley experienced significant change under the influence of modern technologies while the hilly districts continued with the traditional type of shifting cultivation (Seitinthang 2013). The cropping pattern of Jammu and Kashmir union territory was traditionally subsistence having no surplus or negligible amount of products. But the advent of New Agricultural Strategy, the cultivation of high-value crops had accelerated. These crops aided in employment generation, poverty alleviation, income augmentation and export promotion (Akhtar 2015). A total of 177 cropping patterns in the whole Bogra region. The crop diversity index of Bogra region was reported 0.966 and the average cropping intensity at regional level was 234%. Nandigram upzila of Bogra reported highest number of cropping pattern i.e. 36 and Dhupchachia upzila recorded lowest i.e. six only. The ranges of cropping intensity vary 183 to 291% (Islam et al. 2018). The crops such as hybrid maize, hybrid sorghum and sunflower were having relatively constant acreage during the period in Malaprabha project command area.
Moreover, groundnut and maize were predominantly cultivated with enhanced acreage throughout the area (Wali et al. 2019). Most of the villages registered similar cropping pattern from last 20 years in Gautambudh Nagar, district, Uttar Pradesh, India. The large chunk of farmers follow organic farming and apply fertilizers, pesticides to enhance productivity. The cropping pattern was very constant and no farmers were going to change it in upcoming decades because of a number of problems like, lack of irrigation, hiking fertilizer prices, hike in fuel prices, acquiring of land and market failure (Ansari 2015).
Objectives
1.To assess the cropping pattern in Kheri district, Uttar Pradesh, India.
2.To examine the change in the cropping pattern in a period of five years.
Methodology
The present study is based on secondary sources of data. The data has been calculated from the district statistical handbook of Kheri district of respective years. The cropping pattern of the district has been examined by taking into account nine significant crops- rice, wheat, sugarcane, oilseeds, pulses, fodder, maize, vegetables and barley. Rice is produced twice in a year in the Kharif season and Zayed season, both are included in the calculation. Oilseeds consist of mustard, peanuts, sunflower, alsi, til, soyabean. Moreover, the main crop pulses that are recorded in study are arhar, peas, gram, masur, moong, and urad. The area under the cultivation of potato and onion is included in the vegetables. The percentage area under different crop to the total cropped area in the year 2009-10 and 2014-15 was calculated and the changes in the cropping pattern in these five years were assessed. MS office and ARC GIS 10.2 were used in the data analysis and generation of maps.
Study Area
Kheri District has been selected as the study area for this research paper. This district ranks first in terms of area in the state of Uttar Pradesh. The headquarter of Kheri district is situated in the city of Lakhimpur. The district lies in the Lucknow Division (Lucknow is the capital of Uttar Pradesh). The district lies in the coordinates of 27O6’ to 28O6’ North and 80O34’ to 81O30’ east with an altitude of 152 meters from mean sea level. The study area is sprawling in the Terai plains of Uttar Pradesh. Sharda and Gomti river is the main rivers draining the district. The study is characterized by a unique feature, Bhud- the sand tracts lying above the river bed generally along the river course and also beyond that in the seasonal streams’ catchment area. Kheri is a Minority Concentrated District on the basis of 2001 census data, which identifies it as requiring urgent aid to improve living standards and amenities. A 2010 survey published by the Ministry of Urban Development placed Lakhimpur as the second-lowest ranking city in India in terms of sanitation. The study was carried out by analyzing the cropping pattern blockwise throughout the district. The total number of blocks in the Kheri districts are 15, which are as following- Palia, Nighasan, Ramiyabehar, Kumbhi, Bijua, Bankeyganj, Mohammadi, Mitauli, Pasgawan, Behjam, Lakhimpur, Phoolbehar, Nakha, Dhaurehra, and Isanagar.
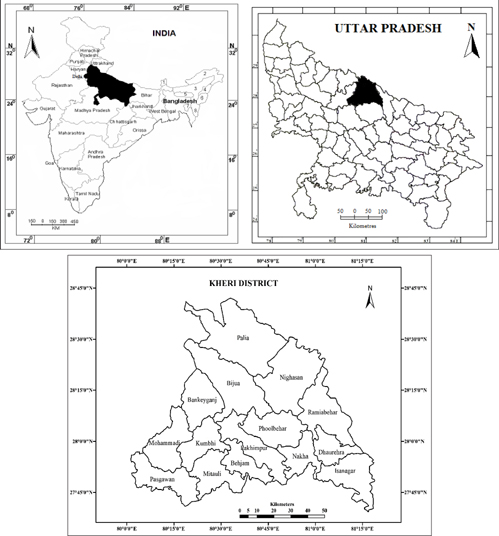
Fig. 1: Study Area
RESULTS AND DISCUSSION
Kheri district, the largest district in Uttar Pradesh has 15 blocks with a great variation in terms of physical features. The northern parts of the district are lying along the border of Nepal, it is a typical terai area having marshy land and forests. While the south-eastern part is sandy having low rainfall and water availability. Consequently, there is great variability in the soil type in the different parts of the district. The central and northern parts have clayey soil while south-western part has sandy soil and south-eastern part has the loamy soil. Hence, the soil has a direct effect on the type of crop grown on a particular landholding. Kheri district is predominantly an agricultural district, most of the population derives its livelihood from agriculture. The total cropped area was recorded 697339 hectares in the year 2009-10 and it has declined to 690257 hectares in the year 2014-15. There was a shrink of 7082 hectares of cropped land in Kheri district caused by a number of factors.
Table 1: Cropwise Percentage of Area in Kheri District During 2009-10 and 2014-15
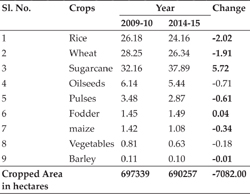
Source: Calculated from the Statistical Handbook of Kheri District.
Table 1 shows the crop-wise percentage of area under different crops in Kheri district in the year of 2009-10 and 2014-15. In the year of 2009-10, the predominant crop in the Kheri district was sugarcane, it was cultivated over 32.16 percent of the total cropped area. Wheat was another crop to be cultivated after sugarcane over an area of 28.25 percent followed by rice which occupied 26.18 percent of the total cropped area. Hence, it is clear that sugarcane, wheat, and rice, three crops were the significant crops in the Kheri district because only these three crops covered 86.59 percent of the total cropped area. In the other crops, oilseeds were significant, 6.14 percent of the area was occupied by the oilseed crops like mustard, sunflower, peanuts, til, etc. Arhar, urad, lentils, and pea were the important pulse crop occupying 3.48 percent of the cropped area. Fodder, maize, vegetable, and barley were insignificantly cultivated in the cropped area. Jwar, bajra, barseem, jao, sarson (mustard) etc. are the main fodder crop, which is grown for a short period of time. These crops are cut for animals in the early days of their growing period when they are soft and green. Maize was grown in Kharif and Zayed seasons. Vegetables (including onion and potato) were grown in a very small proportion to the total cropped area. Barley was very negligible in the district, grown only in the dry and sandy areas.
In the year 2014-15, the area under sugarcane and fodder crops was enhanced while the area under all other crops was declined as compared to the year of 2009-10. The area under sugarcane was increases by 5.71 percent and it accounts for 37.89 percent to the total cropped area in the year 2014-15. The area under rice and wheat was shrunk in these five years by -2.02 and -1.91 percent respectively. In all other crops there was no significant change in the cropped area. For instance, the area under oilseeds decreased by -0.71 percent, area under fodder increased by 0.04 percent, area under maize declined by -0.34 percent, area under vegetables shrank by -0.18 percent and the area under barley decreased by -0.01 percent in this duration of five years.
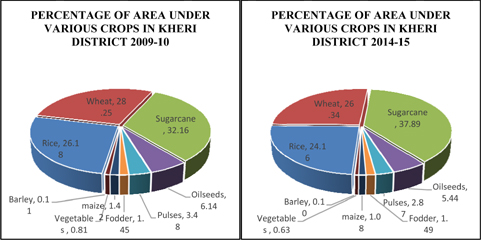
Fig. 2: Area under different crops
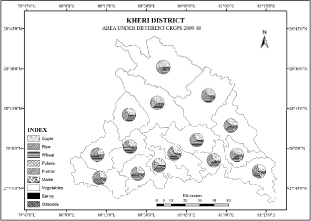
Fig. 3: Crop pattern in 2009-10
Table 2 explains the block-wise percentage of area under different crops in the year 2009-10. Data revealed that Nighasan block had the highest cropped area i.e. 8.88 percent (61924 hectares) and Nakha block had least cropped area i.e. 4.95 percent (34544 hectares) in the district. Generally, it has been observed that sugarcane was the main crop of Kheri district. Sugarcane was cultivated over the largest proportion of area in 9 out of 15 blocks of the district, i.e. Palia (50.52 percent), Nighasan (33.70 percent), Ramiabehar (34.45 percent), Bijua (35.95 percent), Behjam (35.37 percent), Lakhimpur (29.56 percent), Nakha (35 percent), Dhaurehra (39.04 percent) and Isanagar (30.38 percent). Wheat is a major crop in 4 blocks, i.e. Kumbhi (32.56 percent), Mohammadi (38.67 percent), Mitauli (34.07 percent), and Pasgawan (36 percent). While, rice is the third important crop in the district and it is grown in two seasons in the year- kharif and zayed. Rice is a major crop in Bankeyganj (37.62 percent) and Phoolbehar (33.37 percent) blocks. The cultivation of oilseeds witnessed the highest percentage of area in Dhaurehra block i.e. 8.95 percent followed by Ramiyabehar (8.84 percent) and Kumbhi (8.48 percent). Bankeyganj accounted lowest area under oilseeds cultivation i.e. 03.31 percent. Moreover, pulses occupied the highest percentage of area in Isanagar Block (7.43 percent), while, the least percentage of area under pulses cultivation was exhibited by Palia Block (1.24 percent). Fodder crops sprawled over highest percentage of area
Table 2: Block Wise Percentage of Area Under Different Crops to Total Cropped Area 2009-10 in Palia block i.e. 2.41 percent and lowest in Dhaurehra and Isanagar block i.e. 0.55 percent in both blocks. Maize was widely cultivated in the block of Isanagar and occupied 7.7 percent and it is negligible in Mitauli block i.e. 0.17 percent. Similarly, vegetables were occupying the highest percentage of area in Mohammadi block (1.44 percent) and least cultivation was recorded in Palia block i.e. 0.34 percent. Pasgawan was sharing the highest percentage of area under barley cultivation and the least percentage of area under barley cultivation was noted in Palia and Bijua block.
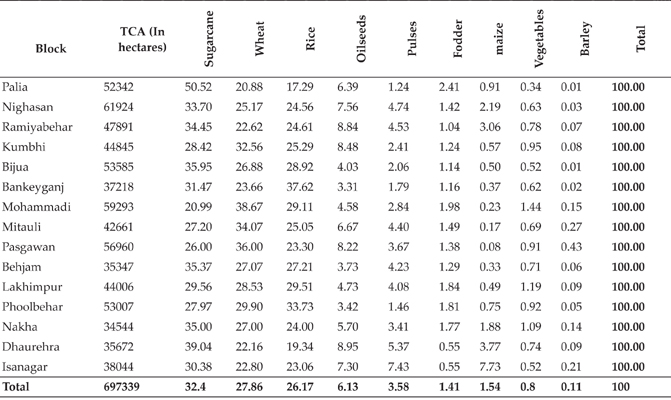
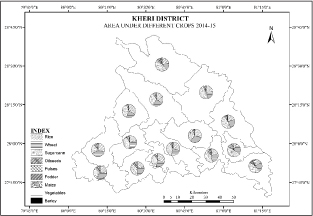
Fig. 4: Crop pattern in 2014-15
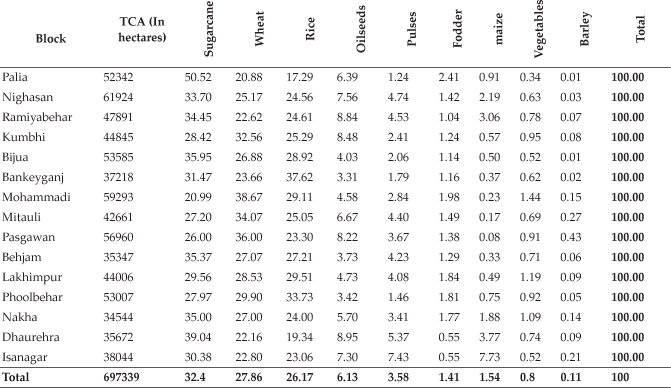
Table 3 analyses the blockwise percentage of area under different crops in the year 2014-15. The data shows that Nighasan block had the highest cropped area in the Kheri district in the year 2014-15 i.e. 10.30 percent (71082 hectares). However, Isanagar registered the lowest cropped area in Kheri district this year i.e. 3.95 percent (27289 hectares). The largest area in the district was still covered by sugarcane crop in the year of 2014-15. There were 12 blocks in 2014-15 as compared to 9 blocks in 2009-10, which had sugarcane as the major crop. These blocks are Palia (46.04 percent), Nighasan (47.81 percent), Ramiabehar (46.26 percent), Kumbhi (38.47 percent), Bijua (33.44 percent), Bankeyganj (38.06 percent), Mitauli (37.39 percent), Behjam (33.61 percent), Lakhimpur (35.32 percent), Nakha (39.64 percent), Dharehra (49.29 percent) and Isanagar (44.69 percent). The highest area under wheat cultivation was registered in Mohammadi (36.75 percent), Pasgawan (33.77 percent) and Phoolbehar (31.28 percent) blocks. Interestingly, there is no such block that would have the largest area under rice cultivation. Although, Bijua accounted the highest percentage of area under rice crop among all the blocks followed by Bankeyganj and Behjam. While Dhaurehra block had lowest area under rice cultivation i.e. 6.09 percent. The oilseeds crops were recorded to occupy highest percent of area in the Palia block i.e. 10.01 percent and Nighasan registered lowest percentage of area under the oilseed crops. Pulses are grown on the highest percentage of area in Dhaurehra block i.e. 4.25 percentage, and lowest area was contributed for pulse crops by Isanagar block. Fodder covered the highest percentage of area in Palia block (2.19) and lowest in Dhaurehra block (0.88 percent). The highest percentage area under maize crop was registered in Isanagar block and lowest was recorded in Pasgawan block. Vegetables were grown on highest percentage of area in Dhaurehra block and lowest in Ramiabehar block. Mitauli block recorded the highest percentage of area under barley cultivation and Nighasan block registered lowest.
Table 3: Block Wise Percentage of Area Under Different Crops to Total Cropped Area 2014-15
Source:Calculated from Statistical Handbook of Kheri District.
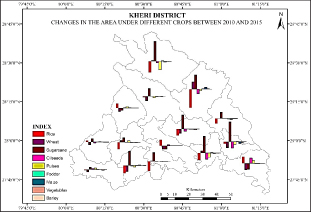
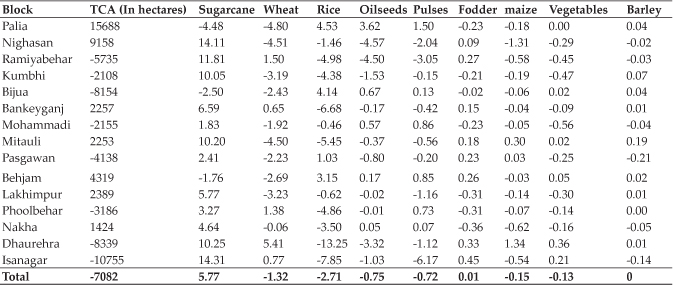
Fig. 5: Change in the crop pattern between 2010 and 2015
Table 4 examined the change in the area under the cultivation of different crops between the years of 2009-10 and 2014-15. Data revealed that there was a net loss of 7082 hectares in the total cropped area of the district in these five years. Total seven blocks, Palia, Nighasan, Bankeyganj, Mitauli, Behjam, Lakhimpur and Nakha blocks experienced gain in cropped area, while rest eight blocks, Ramiabehar, Kumbhi, Bijua, Mohammadi, Pasgawan, Phoolbehar, Dhaurehra and Isanagar experienced loss in the cropped area. While assessing sugarcane crops, it has been found out that there is total 5.77 percent increase in the total cropped area. The highest increase in the cropped area was pointed out in Isanagar block (14.31 percent), followed by Nighasan (14.11 percent) and Ramiabehar (11.81 percent). The maximum loss in the area under sugarcane crop was registered in Palia block i.e. -4.48 percent. The area under wheat crop was decreased in five years by -1.32 percent. The maximum gain in the area under wheat cultivation was experienced in Dhaurehra i.e. 5.41 percent and maximum loss were recorded in Palia block i.e. -4.80 percent. There was loss in the area under the cultivation of oilseeds and pulses (-0.75 percent & -0.72 percent respectively). Oilseeds recorded maximum gain in the cultivated area in Palia block (3.62 percent) and highest deficit in the cropped area in Nighasan block (-4.57 percent). If pulses are considered, the maximum increase in the cultivated area was registered in Palia block i.e. 1.50 percent and the area under pulses was decrease on a record in Isanagar block i.e. -6.17 percent. The area under fodder crops reported maximum increase in Isanagar block and maximum decrease in Nakha block. Moreover, the area under maize cultivation registered highest gain in Dhaurehra block and maximum loss in Nighasan block. Vegetables recorded the maximum increase in the cropped area in Dhaurehra block and maximum loss in the cropped area in Bankeyganj block. In the area under Barley cultivation, there was no change in these five years in the district but particularly block experienced minute changes in the cropped area under barley cultivation.
Table 4: Change in the Area Under Different Crops Between 2010 And 2015
Source:Calculated from Statistical Handbook of Kheri District.
CONCLUSION
From the above analysis, it is evidently revealed that there is great variation in the cropping pattern within the district at block level. This spatial variation in agricultural practices is derived from physical and socio-cultural factors. There are three major crops in the district i.e. sugarcane, wheat and rice. These three crops occupied more than 80 percent area in the district as well as in every block individually. The other crops include oilseed crops, pulses, fodder, maize, vegetable including potato and onion, and barley. In the northern and eastern blocks, the sugarcane crop is dominant because of the marshy land and frequent floods in the rainy season, these blocks include Palia, Nighasan, Ramiabehar, Isanagar and Dhaurehra. No other crop can survive in such waterlogged conditions. Southern and central blocks, exhibiting loamy soil and dry land are comparatively more favorable for the wheat cultivation. However, the rice was grown in all the blocks with a little variation in the block in two seasons, in Kharif season (rainy season) watered by the monsoon rainfall and in Zayed season (dry summer) with the help of irrigation from borewells and canals. Oilseeds were cultivated in almost all the blocks on a minor scale, not more than 10 percent. Overall in the district about 5 percent area in under oilseeds cultivation. While examining the change in the cropped area, there is a net loss of 7082 hectares cropped area in the district from 2010 to 2015. The cropped area under all the crops except sugarcane and fodder experienced decline in these five years. The area under sugarcane cultivation increased drastically. There were many factors reported during the field visit for the changing cropping pattern, the important one was strengthening the market in the district. Because four big sugar mills are established in the district, situated at Kheri, Palia, Gola and Kumbhi towns. The consumption of sugarcane was accelerated with the time, and payment system was improved, therefore farmers opted for sugarcane cultivation. Another reason was deforestation and flash floods, in such conditions only sugarcane survive in the field. The area under rice and wheat was declined in most of the blocks, the farmers reported the declining underground water table or unavailability of the water is the reason to avoid rice and wheat and opt for rainfed crops.
ACKNOWLEDGMENTS
First and foremost, the praises and thanks to Almighty Allah for the completion of this research work. I would like to express my thanks to Dr. Nazim Ali and Sk Ajim Ali for helping me during this study. I would like to acknowledge Amir Khan, Akram Khan, Muntazim Ali for their support and help.
REFERENCES
Akhtar, R. and Acharya, R. 2015. Changes in Cropping Pattern in Jammu and Kashmir, International Journal of Advanced Research in Education & Technology (IJARET), 2(4).
Ali, A. and Ali, M. 2006. Quantifying the Extent and Nature of Risk in Alternative Cropping Patterns in Philippines, The Pakistan Development Review,45 (2): 261-280.
Anderson, J.R. and Dillon, J.L. 1992. Risk Analysis in Dry Farming Systems. Food and Agricultural Organisation of the United Nations. Farm Systems Management Series, 2 .
Ansari, N.A. 2015. Dynamic cropping pattern within the last two decades: A case study of Gautam BuddhNagar District, National Capital Region, India, International Journal of Advanced Research, 3(4): 262-265.
Antle, J.M. 1988. Pesticide Policy, Production Risk and Producer Welfare. An Econometric Approach to Applied Welfare Economics. Resources for the Future. Washington, D.C.
Bhall, G.S. and Singh, G. 1997. Recent Developments in Indian Agriculture: A State Leve Anlysis, Economic and Poitical Weekly, 32(13).
Binswanger, H.P., Jodha, N.S. and Barah, B.C. 1979. Nature and Significance of Risk in the Semi-Arid Tropics. In International Workshop on Intercropping (International Crops Research Institute for the Semi-Arid Tropics), Hyderabad.
Boustani, F. and Mohammadi, H et al. 2010. Determination of optimal cropping pattern due to water deficit: a case study in the South of Iran. Am. Eurasian J. Agric. Environ. Sci., 7 : 591-595.
Chiem, N.H. 1994. Former and Present Cropping Patterns in the Mekong Delta, Southeast Asian Studies, 31 (4).
Dantwala, M.L. 1986. Prices and Cropping Pattern, Economic and Political Weekly, 21 (16): 694-695.
Dhinsa, K.S. and Sharma, A. 1995. Analysis of Cropping Changes in Punjab During 1965-66 to 1990-91, Indian Economic Review, New Series, Delhi School of Economics, University of Delhi; Springer.
Fukui, H. 1974. An Agro-Environmental Study of the Vietnamese Part of the Mekong Delta. Tonan Ajia Kenkyu(South Asian Studies) 12(2): 157-176.
Kumar, R. and Khepar, S.D. 1980. Decision models for optimal cropping patterns in irrigations based on crop water production functions. Agricultural Water Management, 3(1): 65-76.
Mandal, R. 2010. Cropping Patterns and Risk Management in the Flood Plains of Assam, Economic and Political Weekly,45(33): 78-81.
Misra, S.K. and Puri, V.K. 2011. Indian Economy-Its Development and Experience; Himalaya Publishing House, Pvt. Ltd.
Osama, S., Elkholy, M. and Kansoh, R.M. 2017. Optimization of the cropping pattern in Egypt, Alexandria Engineering Journal (2017).
Seitinthang, Lh. 2013. Cropping Pattern Changes in Manipur, Hill Geographer, XXIX (2).
Shetty, P.K. 2004. Socio-Ecological Implications of Pesticide Use in India, Economic and Political Weekly, 39 (49): 5261¬5267.
Shiyani, R.L. and Pandya, H.R. 1998. “Diversification of Agriculture in Gujarat: A Spatio-Temporal Analysis”, Indian Journal of Agricultural Economics, 53 (4): 627-39.
Smith, R.G., Gross, K.L. and Robertson, G.P. 2008. Effects of Crop Diversity on Agroecosystem Function: Crop Yield Response, Ecosystems, 11 (3): 55-366.
Subramanyam, S. and Shekhar, P.S. 2003. Agricultural Growth: Pattern and Prospects, Economic and Political Weekly,38(12/13): 1202-1211.
Wali, V.S., Poddar, R., Mundinamani, S.M. and Yenagi, B.S. (2019). An Analysis of Cropping Pattern in Malaprabha Project Command Area, International Journal of Agriculture Sciences, 11 (2): 7739-7742.